Full-Stack Observability with OpenTelemetry: From Chaos to Clarity
Implementing unified observability across 120+ microservices with OpenTelemetry, Prometheus, Grafana, and SLO-based alerting
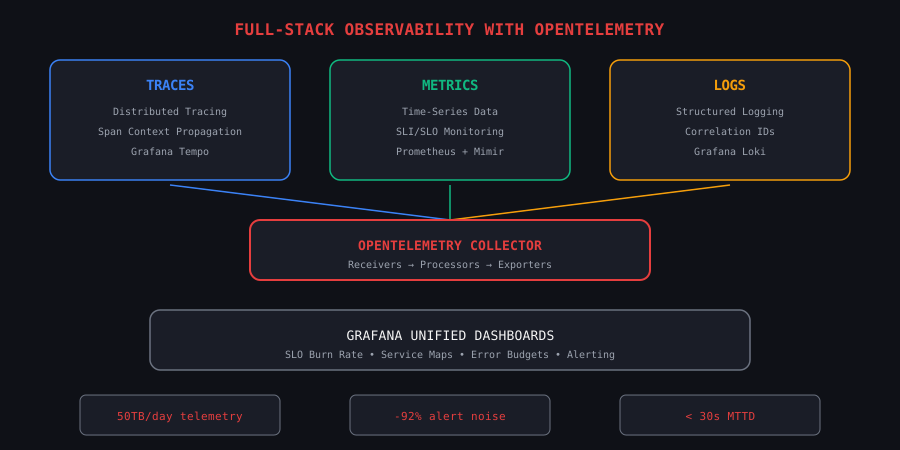
When you're operating 120+ microservices processing 50TB of telemetry data per day, traditional monitoring breaks. Alert fatigue, disconnected tools, and 15-minute detection times become existential threats to reliability. OpenTelemetry provides the unified foundation to correlate traces, metrics, and logs into actionable insights.
This is the story of building an observability platform that reduced alert noise by 92% and achieved sub-30-second mean time to detection.
The Problem: Observability Sprawl
Before the unified platform, our stack looked like this:
- Metrics: Prometheus (fragmented across teams)
- Logs: ELK Stack (slow queries, high cost)
- Traces: Jaeger (partial coverage, no correlation)
- Alerts: PagerDuty + custom scripts (500+ alerts/day)
The result? Engineers spent 40 hours/week on incident triage, MTTD was 15+ minutes, and alert fatigue was causing real incidents to be missed.
The Three Pillars, Unified
OpenTelemetry provides a single SDK and protocol for all three telemetry signals. Here's how we deployed it across our Go and Node.js services:
Instrumentation: Auto + Manual
package main
import (
"context"
"go.opentelemetry.io/otel"
"go.opentelemetry.io/otel/exporters/otlp/otlptrace/otlptracehttp"
"go.opentelemetry.io/otel/exporters/otlp/otlpmetric/otlpmetrichttp"
"go.opentelemetry.io/otel/sdk/trace"
"go.opentelemetry.io/otel/sdk/metric"
"go.opentelemetry.io/otel/sdk/resource"
semconv "go.opentelemetry.io/otel/semconv/v1.21.0"
)
func initTelemetry(ctx context.Context) (func(), error) {
res := resource.NewWithAttributes(
semconv.SchemaURL,
semconv.ServiceName("payment-service"),
semconv.ServiceVersion("1.2.0"),
semconv.DeploymentEnvironment("production"),
)
traceExporter, _ := otlptracehttp.New(ctx,
otlptracehttp.WithEndpoint("otel-collector:4318"),
otlptracehttp.WithInsecure(),
)
tp := trace.NewTracerProvider(
trace.WithBatcher(traceExporter),
trace.WithResource(res),
trace.WithSampler(trace.ParentBased(
trace.TraceIDRatioBased(0.1),
)),
)
otel.SetTracerProvider(tp)
metricExporter, _ := otlpmetrichttp.New(ctx,
otlpmetrichttp.WithEndpoint("otel-collector:4318"),
)
mp := metric.NewMeterProvider(
metric.WithReader(metric.NewPeriodicReader(metricExporter)),
metric.WithResource(res),
)
otel.SetMeterProvider(mp)
return func() {
tp.Shutdown(ctx)
mp.Shutdown(ctx)
}, nil
}
OpenTelemetry Collector: The Central Hub
The Collector receives, processes, and exports telemetry to backend stores:
receivers:
otlp:
protocols:
grpc:
endpoint: 0.0.0.0:4317
http:
endpoint: 0.0.0.0:4318
prometheus:
config:
scrape_configs:
- job_name: "kubernetes-pods"
kubernetes_sd_configs:
- role: pod
relabel_configs:
- source_labels: [__meta_kubernetes_pod_annotation_prometheus_io_scrape]
action: keep
regex: true
processors:
batch:
timeout: 5s
send_batch_size: 1024
k8sattributes:
extract:
metadata:
- k8s.pod.name
- k8s.namespace.name
- k8s.deployment.name
- k8s.node.name
tail_sampling:
policies:
- name: errors-always
type: status_code
status_code: { status_codes: [ERROR] }
- name: slow-traces
type: latency
latency: { threshold_ms: 1000 }
- name: probabilistic
type: probabilistic
probabilistic: { sampling_percentage: 10 }
memory_limiter:
check_interval: 1s
limit_mib: 2048
spike_limit_mib: 512
exporters:
otlp/tempo:
endpoint: tempo:4317
tls:
insecure: true
prometheusremotewrite:
endpoint: http://mimir:9009/api/v1/push
resource_to_telemetry_conversion:
enabled: true
loki:
endpoint: http://loki:3100/loki/api/v1/push
labels:
resource:
service.name: "service"
k8s.namespace.name: "namespace"
service:
pipelines:
traces:
receivers: [otlp]
processors: [memory_limiter, k8sattributes, tail_sampling, batch]
exporters: [otlp/tempo]
metrics:
receivers: [otlp, prometheus]
processors: [memory_limiter, k8sattributes, batch]
exporters: [prometheusremotewrite]
logs:
receivers: [otlp]
processors: [memory_limiter, k8sattributes, batch]
exporters: [loki]
SLO-Based Alerting: The End of Alert Fatigue
The biggest transformation wasn't technical — it was philosophical. We moved from threshold-based alerting (CPU > 80%? Alert!) to SLO-based alerting (error budget burning too fast? Alert!).
Defining SLOs
apiVersion: sloth.slok.dev/v1
kind: PrometheusServiceLevel
metadata:
name: payment-service-availability
spec:
service: payment-service
labels:
team: payments
tier: critical
slos:
- name: availability
objective: 99.95
description: "Payment transactions complete successfully"
sli:
events:
error_query: |
sum(rate(http_requests_total{
service="payment-service",
status_code=~"5.."
}[{{.window}}]))
total_query: |
sum(rate(http_requests_total{
service="payment-service"
}[{{.window}}]))
alerting:
name: PaymentAvailabilityBurnRate
labels:
category: availability
annotations:
summary: "Payment service error budget burning too fast"
page_alert:
labels:
severity: critical
ticket_alert:
labels:
severity: warning
Burn Rate Alerts in Practice
Instead of alerting on every 500 error, we alert on burn rate — how fast the error budget is being consumed:
# Multi-window burn rate alert (Google SRE book approach)
# Page if burning 14.4x budget over 1h AND 6x over 5m
(
  error_budget_burn_rate:1h{service="payment-service"} > 14.4
  and
  error_budget_burn_rate:5m{service="payment-service"} > 14.4
)
or
# Ticket if burning 3x budget over 6h AND 1x over 30m
(
  error_budget_burn_rate:6h{service="payment-service"} > 3
  and
  error_budget_burn_rate:30m{service="payment-service"} > 3
)
This approach reduced our daily alert volume from 500+ to under 40 — a 92% reduction — while catching every real incident faster.
Distributed Tracing: Following Requests Across 120 Services
With OpenTelemetry's context propagation, a single trace follows a request across all services:
import { trace, SpanStatusCode } from "@opentelemetry/api";
const tracer = trace.getTracer("checkout-service");
async function processCheckout(order: Order) {
return tracer.startActiveSpan("process-checkout", async (span) => {
span.setAttribute("order.id", order.id);
span.setAttribute("order.total", order.total);
span.setAttribute("order.items_count", order.items.length);
try {
const inventory = await checkInventory(order.items);
const payment = await chargePayment(order.total);
const shipment = await createShipment(order);
span.setStatus({ code: SpanStatusCode.OK });
return { inventory, payment, shipment };
} catch (error) {
span.setStatus({
code: SpanStatusCode.ERROR,
message: error.message,
});
span.recordException(error);
throw error;
} finally {
span.end();
}
});
}
Grafana: The Unified Dashboard
In Grafana, we correlate all three signals:
- Dashboard shows SLO burn rate trending upward
- Click through to see error rate spike in metrics
- Exemplar links jump directly to the failing trace
- Trace view shows the exact service and span that failed
- Log link shows the structured error with full context
All in under 30 seconds from detection to root cause.
Results: The Numbers Speak
| Metric |
Before |
After |
| Mean Time to Detection |
15+ minutes |
< 30 seconds |
| Daily alert volume |
500+ |
< 40 |
| Hours/week on triage |
40 |
4 |
| Trace coverage |
20% of services |
100% |
| Telemetry data/day |
5TB (fragmented) |
50TB (unified) |
| Cost per GB telemetry |
$2.80 |
$0.40 |
Key Architecture Decisions
-
Collector-per-node, not per-pod: DaemonSet deployment reduces resource overhead and provides node-level visibility.
-
Tail-based sampling: Keep all error traces, sample normal ones. This gives 100% visibility into failures while controlling storage costs.
-
Grafana Mimir over vanilla Prometheus: Mimir provides long-term storage, multi-tenancy, and horizontal scaling that standalone Prometheus can't match at 50TB/day.
-
Structured logs, not free text: Every log line is JSON with correlation IDs. Loki queries against labels are 100x faster than full-text search.
-
SLOs before SLIs: Define what "reliable" means to users first, then instrument to measure it. Not the other way around.
Getting Started
The migration path that worked for us:
- Week 1-2: Deploy OTel Collector and basic Grafana stack
- Week 3-4: Instrument top 10 critical services
- Month 2: Define SLOs for critical services, set up burn rate alerts
- Month 3: Roll out to all services, disable old monitoring
- Ongoing: Refine SLOs based on user impact data
The hardest part isn't the technology — it's convincing teams to trust SLO-based alerting over their beloved threshold alerts. Let the numbers prove it.